Nitrate Concentration of Cereal Forage Species at Three Stages of Maturity
by L.M.M. Surber, S. D. Cash, J.G.P. Bowman, & M. C. Meuchel Montana State University, Bozeman, MT 59717
"The objectives of this research were to test the effects of cereal forage species and stage of maturity on forage nitrate concentration."
Introduction
Cereal forages have become an increasingly economical source of winter feed for livestock producers, comprising 11% of all hay harvested in Montana (Montana Agricultural Statistics Service, 2002). In 2001, 480 thousand tons of small grain hay was produced in Montana, a 19% increase from 2000. Cereal forage production and harvest management techniques are similar to those required by alfalfa (Helsel and Thomas, 1987).
Livestock producers should be concerned with nitrate concentrations when feeding annual cereal forages. Nitrates typically are higher in immature plants and decrease with advancing plant age (Cash et al., 2002). Khorasani et al. (1997) determined that barley had the highest forage quality followed by triticale and then oat. Barley has often been determined to have higher forage quality when compared to oat, wheat, or triticale (Cherney and Martin, 1982; Cherney et al., 1983; McCartney and Vaage, 1994). In addition, Khorasani et al. (1997) found that the nitrate concentration in barley and triticale declined rapidly with advancing maturity while the nitrate concentration of oat remained stable.
Nitrate accumulation in cereal forages has a direct impact on feeding value. Rarely do researchers determine nitrate concentration of cereal forages even though it can reduce or eliminate feeding value. The objectives of this research were to test the effects of cereal forage species and stage of maturity on forage nitrate concentration.
Materials and Methods
- Six cereal forage species (18 varieties) were grown in a randomized complete block design field trial (r = 4) under irrigated conditions in Bozeman, MT
- The cereal forage species included barley (Hordeum vulgare L.), oat (Avena sativa L.), triticale (Triticosecale sp.), emmer (Triticum turgidum L.), spelt (Triticum aestivum L. subsp. spelta), and an experimental wheat x spelt cross (Table 1).
- Plots were 1.52 x 6.10 m in length and spaced 0.46 m apart.
- Forage clip samples were collected at three dates when a majority of the entries were in the stages of plant maturity: boot, anthesis and water y to milk grain stage.
- A 15 - cm clip sample of one row was cut at stubble height and dried at 60°C for 48 h.
- Forage clip samples were ground to pass a 1 - mm screen in a Wiley mill and evaluated for DM and nitrate - nitrogen (NO3 - N; AOAC, 2000).
- Data were analyzed using the GLM procedure of SAS to test the effects of cereal forage species, stage of maturity and their interactions on forage nitrate - N concentration (SAS Inst. Inc., Cary, NC).
- When a significant F - value was found (P < 0.10), means were separate d using LSD.
Table 1. Cereal forages evaluated for nitrate - N concentrations in 2002.
|
Species
|
Forage
|
|---|---|
|
Two-row Feed Barley
|
Baronesse, BZ598 227*, H3*, Haxby, Karl, Lewis, Logan, Valier |
|
Two-row Malt Barley
|
Harrington
|
|
Two-row Forage Barley
|
Haybet, Hays
|
|
Six-row Forage Barley
|
Bestford, Westford
|
|
Emmer
|
Lucile
|
|
Oat
|
Otana, Paul, Rio Grande, Triple Crown
|
|
Spelt
|
SK3P
|
|
Triticale
|
Pronghorn
|
|
Wheat X Spelt
|
93ST59
|
Results
- The range in NO3-N across stages of maturity was from 0.01 to 0.55% (CV = 47.21%). The mean was 0.22 % NO3-N (SD = 0.103 %).
- There were significant (P < 0.05) cereal forage species, stage of maturity and species x maturity interaction effects on NO3-N con centration.
- Nitrate - nitrogen concentration at the boot stage of maturity did not differ (P > 0.05) when compared to the anthesis stage of maturity (avg. 0.244 %; Table 2). However, NO3-N concentration at harvest was 36 % lower than at anthesis (0.168 vs. 0.230 %, respectively).
- Barley forage NO3-N was similar (P > 0.05) when compared to emmer, triticale and the wheat x spelt cross (avg. 0.195 %) and lower (P < 0.001) when compared to oat and spelt forage (0.186 vs. 0.341 and 0.258 %, respectively; Table 3).
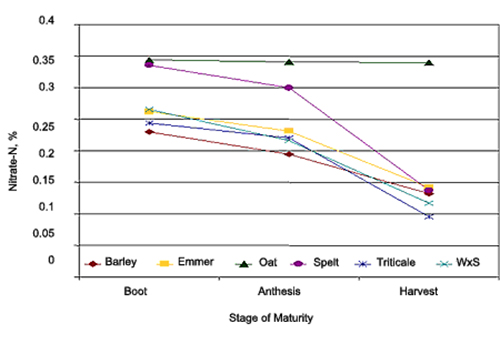
- Two-way interaction of stage of maturity and species on nitrate - N concentration is presented in Figure 1.
- Barley forage NO3-N concentration was highest (P < 0.05) at the boot stage, intermediate at anthesis and lowest at harvest (0.230, 0.195 and 0.13 1%, respectively).
- Oat forage maintained high NO3 - N concentrations at all growth stages (P > 0.05; avg. 0.341%).
Table 2. Sample numbers (n), means and standard deviations for nitrate - N concentrations at three stages of maturity (a) for six cereal forages.
|
Stage of Maturity
|
N
|
Mean
|
SD
|
|---|---|---|---|
|
Boot
|
88
|
0.26
|
0.100
|
|
Anthesis
|
88
|
0.23
|
0.087
|
|
Harvest
|
87
|
0.17
|
0.103
|
|
Species
|
N
|
Mean
|
SD
|
|
Barley
|
167
|
0.19
|
0.085
|
|
Emmer
|
12
|
0.21
|
0.065
|
|
Oat
|
48
|
0.34
|
0.089
|
|
Spelt
|
12
|
0.26
|
0.097
|
|
Triticale
|
12
|
0.19
|
0.088
|
|
WxS
|
12
|
0.20
|
0.070
|
Implications
Nitrate concentrations at boot and anthesis stages of maturity were similar to each other but higher than the harvest stage of maturity. Barley forage NO3 - N was similar to emmer, triticale and an experimental wheat x spelt cross and lower when compared to oat and spelt forage. Also, NO3 - N concentrations of various cereal forage species respond differently at boot, anthesis and harvest. This implies that different harvest management must be implemented for oat when compared to other cereal forage species.
Literature Cited
- 2000. Official Methods of Analysis (17th Ed.) Association of Official Analytical Chemists, Gaithersburg, MD.
- Cash, D., R. Funston, M. King, and D. Wichman. 2002. Nitrate toxicity of Montana forages. Montana State University Extension Service. MontGuide 200205.
- Cherney, J. H., and G. C. Marten. 1982. Small grain crop forage potential: I. Biological and chemical determinants of quality and yield. Crop Sci. 22:227 - 231.
- Cherney, J. H., G. C. Marten, and R. D. Goodrich. 1983. Rate and extent of cell wall digestion of total forage and morphological components of oats and barley. Crop Sci. 23:213 - 216.
- Helsel, Z. R., and J. W. Thomas. 1987. Small grains for forage. J. Dairy Sci. 70:2330 - 2338.
- Khorasani, G. R., P. E. Jedel, J. H. Helm, and J. J. Kennelly. 1997. Influence of stage of maturity on yield components and chemical composition of cereal grain silages. Can. J. Anim. Sci. 77:259 - 267.
- McCartney, D. H., and A. S. Vaage. 1994. Comparative yield and feeding value of barley, oat and triticale silages. Can. J. Anim. Sci. 74:91 - 96.
Figure 1. Nitrate - N concentrations of six cereal forages grown under irrigated conditions in 2002 near Bozeman, MT.